Visualization Examples
[1]:
import gdmate as gd

import matplotlib.pyplot as plt
import numpy as np
import pyvista as pv
Start Xvfb if on headless machine
Pyvista plotting will require Xvfb if running headless (e.g., on Binder). If you are using a local machine, you do not need to run this, but on Binder and other headless environments you will.
[ ]:
pv.start_xvfb()
Plot a 2D grid as an image on a Matplotlib axes
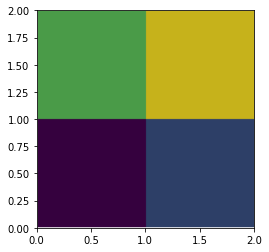
The function pyvista_vis.pv_plot_2d takes a 2D Pyvista mesh and plots it using the bounds specified and colors it by the appropriate field. The code block below creates a sample Pyvista mesh of 9 cells (16 points), assigns each cell a value of 0-8, and the plots the 4 cells in the lower left on a Matplotlib axes with colors determined by the assigned value of the cell
[2]:
# Create unstructured grid mesh of 4x4 points and 3x3 cells
mesh = pv.UniformGrid(dims=(4, 4, 1)).cast_to_unstructured_grid()

# Assign scalar value of 0-8 to each of the nine cells
mesh['sample_field'] = np.arange(9)

# Set up Matplotlib figure/axes
fig,ax = plt.subplots(1)

# Plot the mesh on the axes and color by the scalar values
ax = gd.pyvista_vis.pv_plot_2d(mesh,'sample_field',bounds=[0,2,0,2],ax=ax)